
Then it probably helps to know how and what we are currently using. Not having a picture of that was frustrating me, until someone at work send me this graphic which, compliments of the US Energy Dept., does a nifty job of putting a lot of information into a simple map.
Energy Flow, 2009
(Quadrillion Btu)
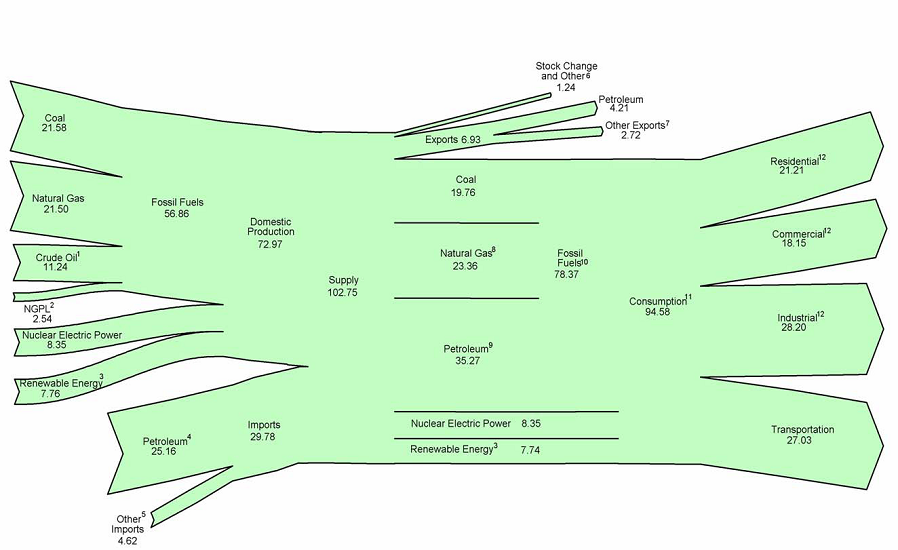
1 Includes lease condensate.
2 Natural gas plant liquids.
3 Conventional hydroelectric power, biomass, geothermal, solar/photovoltaic, and wind.
4 Crude oil and petroleum products. Includes imports into the Strategic Petroleum Reserve.
5 Natural gas, coal, coal coke, biofuels, and electricity.
6 Adjustments, losses, and unaccounted for.
7 Coal, natural gas, coal coke, electricity, and biofuels.
8 Natural gas only; excludes supplemental gaseous fuels.
9 Petroleum products, including natural gas plant liquids, and crude oil burned as fuel.
9 Petroleum products, including natural gas plant liquids, and crude oil burned as fuel.
10 Includes 0.02 quadrillion Btu of coal coke net exports.
11 Includes 0.12 quadrillion Btu of electricity net imports.
12 Total energy consumption, which is the sum of primary energy consumption, electricity retail
sales, and electrical system energy losses. Losses are allocated to the end-use sectors in
proportion to each sector’s share of total electricity retail sales. See Note, “Electrical Systems
Energy Losses,” at end of Section 2.
Notes: • Data are preliminary. • Values are derived from source data prior to rounding for
publication. • Totals may not equal sum of components due to independent rounding.
Sources: Tables 1.1, 1.2, 1.3, 1.4, and 2.1a.
U.S. Energy Information Administration / Annual Energy Review 2009
